
Tarini Shah | Blogger
Followers
85,103
Uploads
336
Engagement
42.19%
Statistics Summary

Account Stats Summary
Export to csvShowing last 15 entries.
| Date | Followers | Following | Uploads | ||||
|---|---|---|---|---|---|---|---|
| 2022-06-28 | Tue | 85,103 | - | 1,492 | - | 336 | - |
| 2022-06-03 | Fri | 85,103 | - | 1,492 | - | 336 | - |
| 2022-04-10 | Sun | 85,103 | - | 1,492 | - | 336 | - |
| 2022-02-12 | Sat | 85,103 | - | 1,492 | - | 336 | - |
| 2022-02-01 | Tue | 85,103 | - | 1,492 | - | 336 | - |
| 2022-01-12 | Wed | 85,103 | - | 1,492 | - | 336 | - |
| 2021-10-12 | Tue | 85,103 | - | 1,492 | - | 336 | - |
| 2021-10-02 | Sat | 85,103 | - | 1,492 | - | 336 | - |
| 2021-09-20 | Mon | 85,103 | - | 1,492 | - | 336 | - |
| 2021-07-29 | Thu | 85,103 | - | 1,492 | - | 336 | - |
| 2021-03-10 | Wed | 85,103 | +4,073 | 1,492 | +8 | 336 | +2 |
| 2021-02-20 | Sat | 81,030 | +19,170 | 1,484 | +125 | 334 | +21 |
| 2020-11-20 | Fri | 61,860 | +2,455 | 1,359 | +27 | 313 | +7 |
| 2020-10-23 | Fri | 59,405 | - | 1,332 | - | 306 | - |
| Total Summary | +25,698 | +30 | |||||
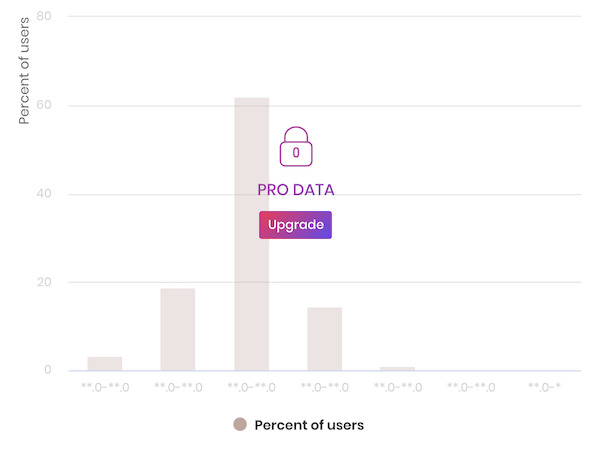
Average Engagement Rate Chart
Each value in this chart is equal to the Average Engagement Rate of the account in that specific day.
Future Projections
Here you can see the approximated future projections based on your previous days averages
| Time Until | Date | Followers | Uploads |
|---|---|---|---|
| Current Stats | 2025-06-24 | 85,103 | 336 |
| 30 days | 2025-07-24 | 86,423 | 366 |
| 60 days | 2025-08-23 | 87,743 | 396 |
| 3 months | 2025-09-22 | 89,063 | 426 |
| 6 months | 2025-12-21 | 93,023 | 516 |
| 9 months | 2026-03-21 | 96,983 | 606 |
| 1 year | 2026-06-24 | 101,163 | 701 |
| 1 year and half | 2026-12-23 | 109,171 | 883 |
| 2 years | 2027-06-24 | 117,223 | 1,066 |
| Based on an average of | +44 followers /day | +1 uploads /day | |
Top Posts
Top posts from the last 10 posts
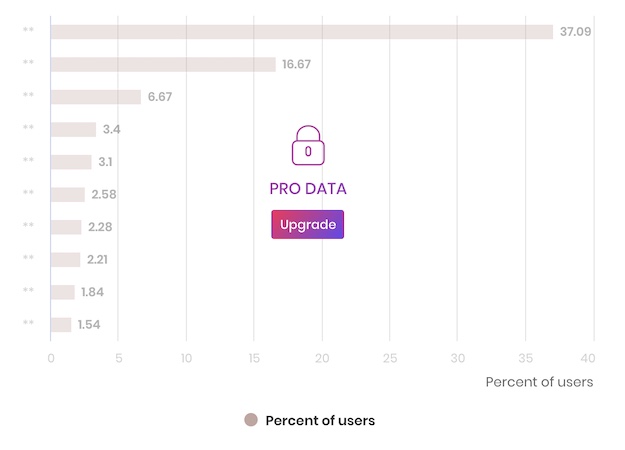
Engagement Rates on Instagram
These are overall / average engagement rates found on Instagram. Statistics based on analysis of more than 1 million influencer profiles.
| Followers | Other Average Engagement | Profile Engagement |
|---|---|---|
| < 1,000 | 8% | |
| < 5,000 | 5.7% | |
| < 10,000 | 4% | |
| < 100,000 | 2.4% |
|
| 100,000+ | 1.7% |
Media Stats Summary
Showing last 10 entries.